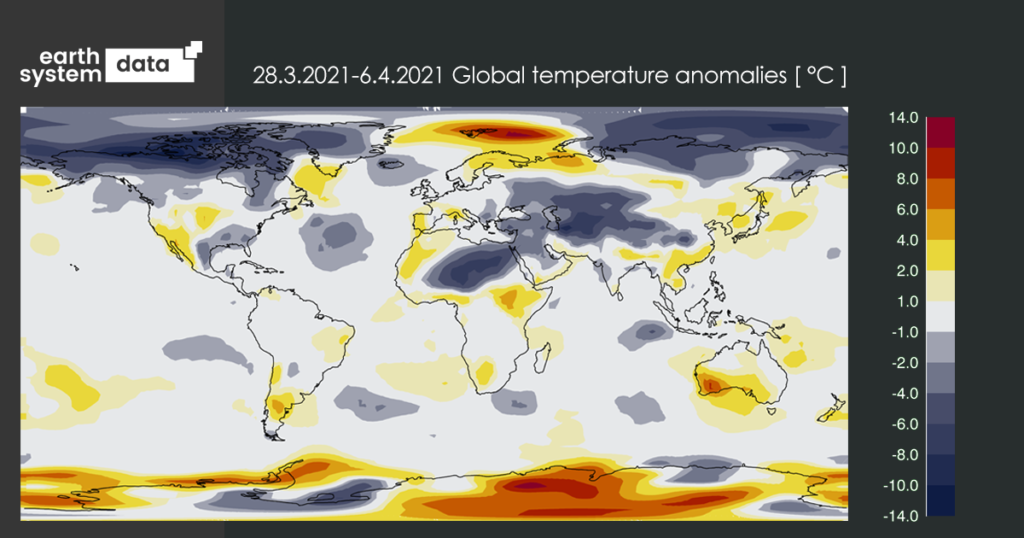
Early April has been dominated by notable cold surface temperature anomalies over much of the northern hemisphere – shown in ESD48’s code run on NOAA/NCEP data for 28th March through April 6th [Image 1]. Curiously these cold anomalies are positioned over sub arctic regions, which normally exhibit strong warmer-than-normal conditions – since these areas are heating the most rapidly as Earth’s mean temperature continues to rise. An expanse of cold anomalies, too, occupies Eurasia. The pattern and expanse of these anomalies suggests something larger is afoot for now rather than, simply, the regional displacement of cold air to another (relatively warmer) region — i.e. the type of circulation response to things like polar vortex displacements.
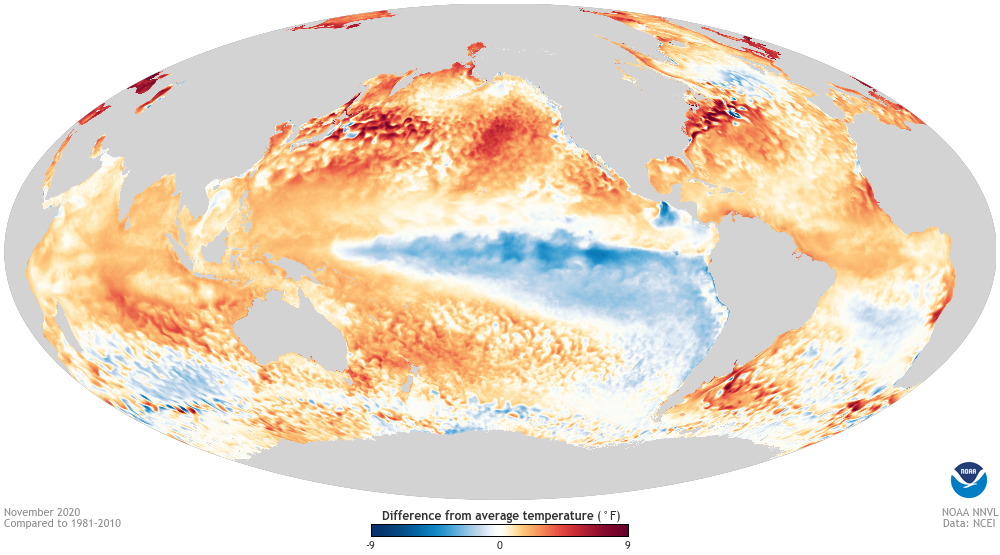
One primary candidate for this type of signal – at least as a contributing party – is the sister of the widely-known Pacific Ocean El-Nino phenomenon – aka ‘La Nina’. Bluntly put, La Nina is the reverse of the warm sea temperatures associated El-Nino, resulting in massive swathes of cooler-than-normal sea temperatures in the eastern Pacific, large enough to exert influence on the global mean temperature. Earth is currently in a sustained La Nina phase — this plot [image 2, November 2020, NOAA OISST] shows the extent, and the episode (just) offset 2020 from being the warmest globally on record. The current episode began approximately in September 2020. If five 3-month averages of sea temperatures over the Eastern Pacific (and specifically an area known as Nino3.4) are below -0.5°C (compared to normal) then we’re officially in a La Nina phase.
We’ve had seven 3-month means well below that criteria to date. Therefore, an ongoing imprint on global temperatures is well expected. The scale of La Nina, and its capacity to influence the planet’s mean temperature, owes to the ocean dynamics that cause it: enormous pools of deeper, colder ocean water rise to the surface at the South-American coast, and pool westwards. – CW
Image 1: Global temperature anomalies relative to 1981-2010 for early April, via ESD48 [raw un-anomalised data NOAA/NCEP PSD]
Image 2: Sea surface temperatures November 2020, relative to expected conditions [via NOAA OISST visualiser]
ESD48 is EarthSystemData’s 48-hourly code run on official NOAA data, producing global overviews of current global temperature and rainfall anomalies. It is a climate monitoring product visualising the latest cold/warm/wet/dry regions, together with some UN IPCC climate projections out to 2100. Click here.