Our notion and concepts of extreme climate is shaped by our experiences. Generally these experiences are confined by where we live – or where we have travelled to. My professional research – and the work undertaken for EarthSystemData – gives me insights to all corners of the planet and some pretty astonishing aspect of the climate system. (astonishing to me but, at the same time, not so much for the people who live there – or have spent any amount of time there). Let’s take a moment to consider rainfall. Serious rainfall.
It’s a bit drizly today
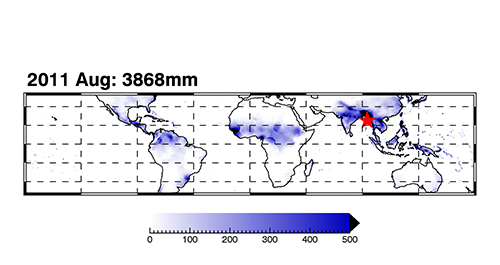
What does a wet month mean to you? Searching through some data records at hand I thought it’d be a fun task to pull up the maximum monthly rainfall total within the record (1901-2016). If you were to guess off hand where in the world where this might occur you’d probably be thinking ‘monsoon’ type areas, and you’re not wrong. We’ll deal with the monsoon system in another post and learn a bit more about it, but let’s just consider some numbers. The maximum monthly rainfall within the record coverage came in at an utterly mind boggling 4000mm (3868mm to be precise), within the coastal zone of Bangladesh / Burma:
Red star marks the spot. The highest monthly rainfall total in one observational record [CRU TS 4: https://crudata.uea.ac.uk/cru/data/hrg/cru_ts_4.01/]. I limited the scale to 500mm — everything black is well over that value.
4000mm — a.k.a. 4 meters in one month. The height of this bus:
A double decker bus. Not the normal unit of rainfall measurement, but it depends where you live.
For comparison, in a whole year, New York might receive something like 1000mm. London, more like 500mm. The exact circumstances surrounding summer 2011 in SE Asia were a pronounced heavy monsoon period after a mild winter, leading to landslides, deadly floods and radical transformation of the landscape as seen in this NASA alert. Sadly these impacts are not isolated…in a ‘normal’ monsoon month for the location marked above with the red star, you might expect something like 1000mm of rain, which is hazardous in its own right. But, at the same time, these sudden deluges act as the life blood for the intense agricultural production of the area.
Next level rainfall amounts.
Global data used in climate monitoring is usually arranged into ‘grid cell’ value – that is the values are the average rainfall amounts (or temperatures) for, say a 50km by 50km square. The actual rainfall amounts for a point location (a precise location within the grid cell) can be more than the grid cell mean. In the case of rainfall, when the grid-cell average can be something like 4000mm for the month, actual point locations can, incredibly, be well in excess of these. Consider the record-breaking Bangladeshi local rainfall that occurred in April 2017: Station locations here recorded in excess of 8 metres for the month. 8 meters. In order to achieve this total it we assume equal amounts fell each day during the month (it may not have), then it must’ve rained >260mm a day. For the whole month.
These amounts are staggering to those who live outside the monsoon affected areas. A ‘torrential’ days rain in Europe during summer thunder storms may be something like 300mm. To have 30-days, sequentially, of those amounts is unheard of. To get a picture (a fairly odd one) of the physical amount, put the London bus to one side, and consider two giraffes standing on top of each other.
Under certain circumstances, the ability of the ocean-atmosphere system to deliver enormous amounts of rainfall is formidable. We’ll write another post considering the possible affects of ongoing climate change on this remarkable system. But you can explore plots and data for yourself of the latest rainfall anomalies — and climate projections out to 2100, including locations within the Asian / SE Asian monsoon, in our subscription service. Join now for 30-days free and see for yourself. -CJW